A fresh screen of U.S. equities flagged a cluster of S&P 500 names as overbought, sharpening debate over whether momentum has outrun fundamentals. The review, conducted with CNBC Pro’s stock screener and focused on the 14-day Relative Strength Index (RSI), highlights pockets of froth in a market that has climbed on resilient earnings and easing inflation pressures.
The finding arrives as traders weigh a soft-landing narrative against tight valuations. It also comes ahead of key economic releases that could sway rates and sentiment. While an overbought reading does not guarantee a pullback, the alert may prompt investors to reassess position sizes and risk controls.
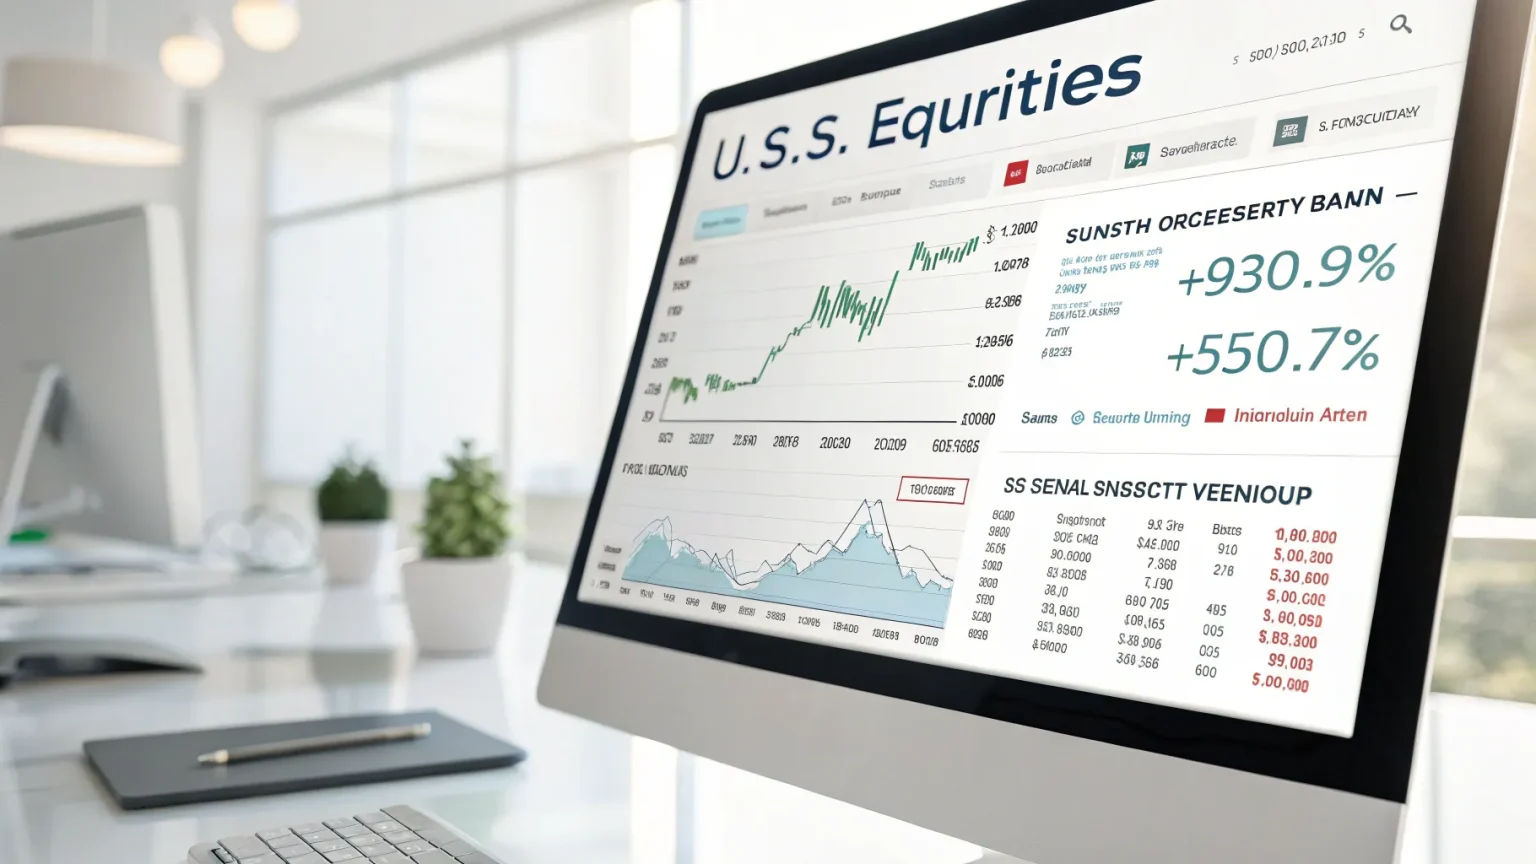
Using the CNBC Pro stock screener tool, we found the S&P 500’s most overbought stocks according to their 14-day relative strength index, or RSI.
Why RSI Matters Now
RSI is a momentum gauge that compares the scale of recent gains to recent losses over a set period, often 14 days. Readings range from 0 to 100. Levels above 70 are often considered overbought, and below 30 oversold.
Overbought does not mean a stock is “too expensive” on earnings or cash flow. It means the recent pace of buying has been strong relative to selling. In rising markets, RSI can remain elevated for weeks as money rotates into leaders.
That is why professional traders often pair RSI with trend analysis, valuation checks, and catalysts such as earnings, guidance, or regulatory news. Momentum signals tend to be most useful when they align with other evidence.
How Overbought Signals Are Used
Portfolio managers use RSI in several ways. Some trim positions when RSI spikes, locking in gains while keeping a core stake. Others wait for a drop back through 70 as a sign that momentum is fading. Short-term traders may look for divergences, where a stock sets a new high but RSI fails to confirm, hinting at weakening strength.
Long-only investors sometimes treat overbought readings as a reason to pause new buys rather than to sell outright. They may set price alerts or stagger entries to manage timing risk.
- RSI above 70: possible stretched conditions.
- RSI crossing down through 70: potential momentum cooling.
- Confirm with volume, trend, and upcoming events.
Market Context and Recent Trends
The broader market has been supported by steady earnings, productivity gains, and expectations for policy stability. That backdrop has favored large-cap winners and powered momentum factors. As a result, technical gauges have heated up in multiple sectors at times this year.
History shows that clusters of overbought readings tend to appear during strong advances. Pullbacks from such levels can reset sentiment without breaking longer uptrends. The depth of any retreat often depends on macro shocks, earnings revisions, and liquidity.
Investors will watch upcoming inflation prints, employment data, and corporate updates. These could either validate momentum or spark a cooldown.
Risks and Opportunities for Investors
For holders of names tagged as overbought, the key risk is a sharp reversal driven by crowded positioning. Tight stop-losses, reduced position sizes, or hedges can help limit damage if a swing lower follows.
There can be opportunity as well. Strong momentum sometimes signals improving fundamentals or rising estimate revisions. In those cases, brief dips after overbought signals may offer entry points, especially if long-term trends remain intact.
Risk management matters most around earnings dates, regulatory rulings, or product launches. A positive surprise can keep RSI elevated. A miss can flip momentum quickly.
What to Watch Next
Traders will track whether the flagged stocks hold gains, consolidate, or break lower on heavier volume. They will also monitor sector breadth to see if strength remains concentrated or broadens.
For longer-term investors, the takeaway is simple: treat RSI as one tool, not a verdict. Pair it with fundamentals, cash flow trends, and guidance quality. If momentum cools while earnings stay strong, any pullback may be short-lived. If momentum cools and estimates slip, a deeper reset could follow.
The latest screen sends a clear message about market temperature. It does not call the top. As data and earnings roll in, the durability of this rally will be tested. Watch for shifts in breadth, confirmation from volume, and whether leadership rotates or holds. Those signals will say more about the trend than any single indicator can.


