The Federal Reserve’s latest projections point to a federal funds rate of 3.4% at the end of 2026, offering a clear signal on the path ahead for borrowing costs. The estimate, drawn from policymakers’ individual rate forecasts, gives households, businesses, and markets a view of where officials expect policy to land in the medium term. It arrives as inflation cools from recent peaks, while growth and hiring remain in focus.
The central bank’s so-called dot plot indicates a median estimate of 3.4% for the federal funds rate at the end of 2026.
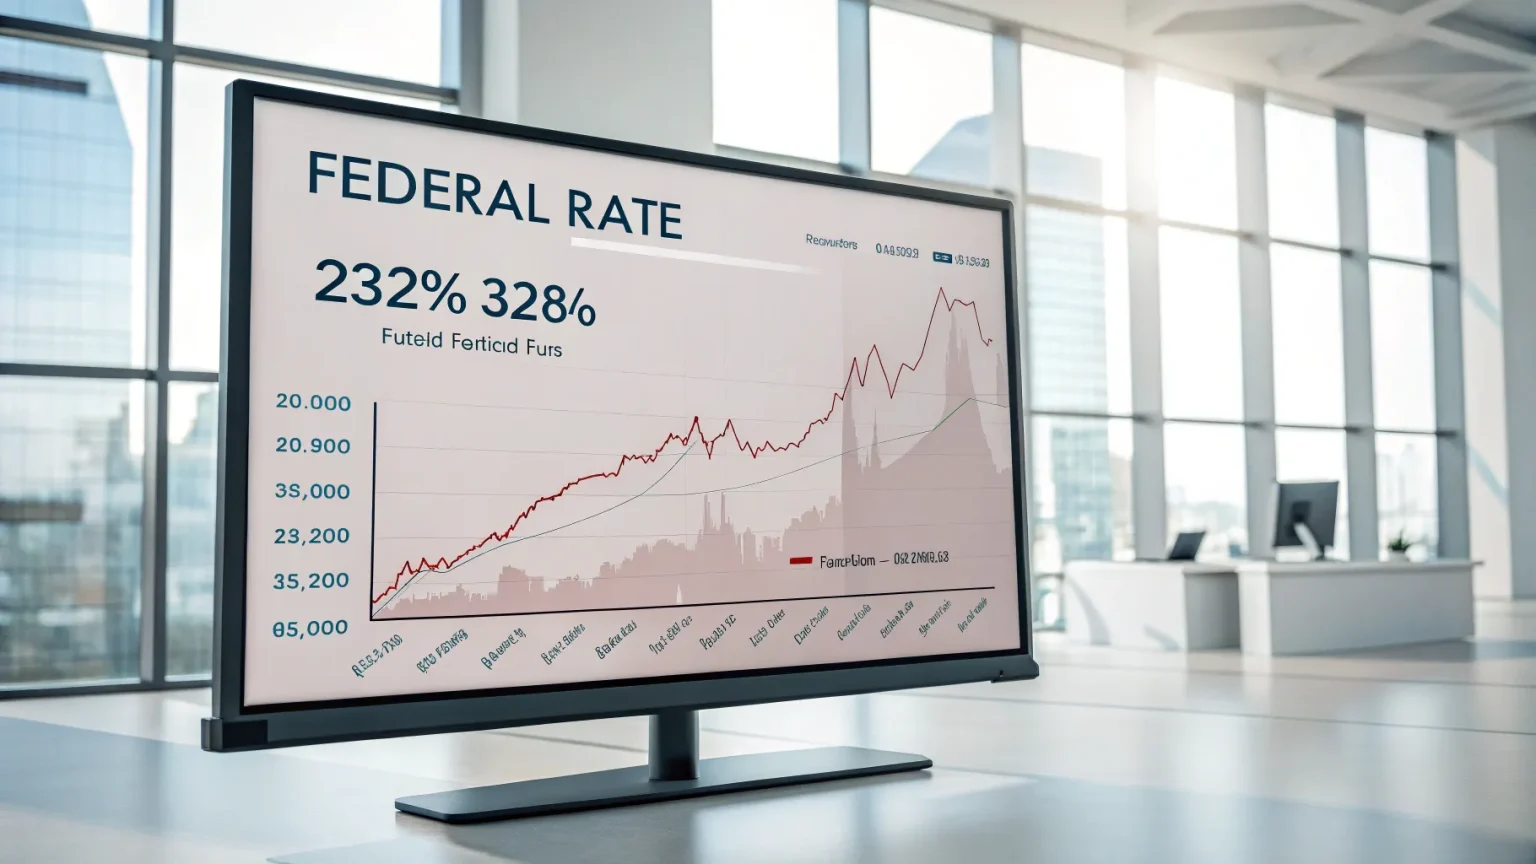
What the Dot Plot Means
The dot plot is a chart published four times a year. Each dot reflects a single policymaker’s year-end rate forecast for the next few years and the long run. The median dot is often used as a yardstick for the committee’s center of gravity.
A 3.4% median for 2026 suggests officials expect rates to settle well below recent highs, yet remain above the very low levels seen before the pandemic. It implies a gradual path down, consistent with steady inflation progress and a stable job market.
This projection is not a promise. It is a best guess based on current data. Shifts in inflation, growth, or financial conditions could change the outlook.
Market and Economic Implications
Investors watch the dot plot because it shapes expectations for bond yields and stock valuations. A 3.4% policy rate in 2026 points to a higher cost of capital than in the 2010s, but lower than the tight stance used to fight recent inflation.
For borrowers, the signal hints at eventual relief compared with peak rates. Mortgage and auto loan costs tend to move with longer-term yields, which reflect both current policy and future rate expectations. Savers may see deposit rates ease from recent highs if the path lower takes hold.
Businesses face a mixed picture. A step-down in rates can support investment, yet funding costs could remain firm compared with the last decade. Pricing power, wages, and productivity will shape margins in the years ahead.
How This Compares With Recent Years
During the 2010s, the policy rate spent long stretches near zero. The surge in inflation after 2021 led to the fastest tightening cycle in decades. That pivot pushed rates to levels not seen since before the global financial crisis.
A 3.4% endpoint by 2026 would mark a middle ground. It suggests policymakers see inflation moving closer to target without severe damage to growth. It also hints that the long-run “neutral” rate may be higher than many assumed before the pandemic, though there is wide debate on that point.
Different Views Within the Fed
Policymakers do not vote on a single forecast. Each dot reflects an independent view. Some officials tend to worry more about inflation risks and lean toward higher rates. Others place more weight on employment and financial stability and prefer a gentler path.
The spread of dots shows that uncertainty remains. If inflation proves sticky, the 2026 rate could end higher than the median. If price pressures fade faster, rate cuts could come sooner or go deeper.
Key Factors That Could Shift the Path
- Inflation trends: Core price measures guide the pace of any cuts.
- Labor market: Hiring, wage growth, and participation affect demand.
- Growth: Consumer spending and business investment set the tone.
- Global risks: Energy prices, supply chains, and geopolitics can sway outcomes.
- Financial conditions: Credit flows and market stress can influence decisions.
What to Watch Next
Future inflation reports will test the case for lower rates. Monthly readings on jobs and wages will also be crucial. Financial markets will react to each data point, especially if it challenges the current path.
For now, the 3.4% median gives a marker for planning. It signals slower, patient moves rather than sharp swings. Households and firms can use that guide while staying alert to changes in the data and the policy debate.
The headline message is steady rather than dramatic: policy is likely to ease over time, but not back to the ultra-low era. The next few months will show whether inflation and growth align with that plan or push officials to adjust.


